Sam Adams, Agricompas Head of Programmes

At EcoProMIS, we are well aware that our project is both exciting as well as full of demands, requiring careful planning and communication. In my last blog article I explored how we are managing the complexities of a five-year international agri-tech project.
I mentioned in that previous article that to help manage complexity, we have implementing a new cloud-based project management system. Today I share a bit more about that process and how we have introduced ‘Gantt’ to clarify roles and responsibilities, manage expectations, and design a robust and logical workflow.
Cloud to the Rescue
The EcoProMIS team is spread over seven organisations, based in multiple sites in both the UK and Colombia. There is a six hour time difference. Because of these logistical realities, we have chosen to work with cloud-based digital communication and project management.
So, like most of us during this time of global working-from-home, we have been extensively using digital communication tools. How grateful we are that these tools are widely available! It would have been a very different picture just a few years ago.
In practice, this means that for daily communication we use a mobile chat app, the usual email correspondence, and we are slowly getting used to Microsoft Teams (having previously used Slack for years, this is a bit of an adjustment).
Gi-GANTT-ic Support
In addition to these daily conversations and regular team meetings, there is still the need for an advanced system of project management. For a project of our size, this is a gi-GANTT-ic need. So over the past weeks and months, I have been setting up a Gantt chart system for our EcoProMIS project management.
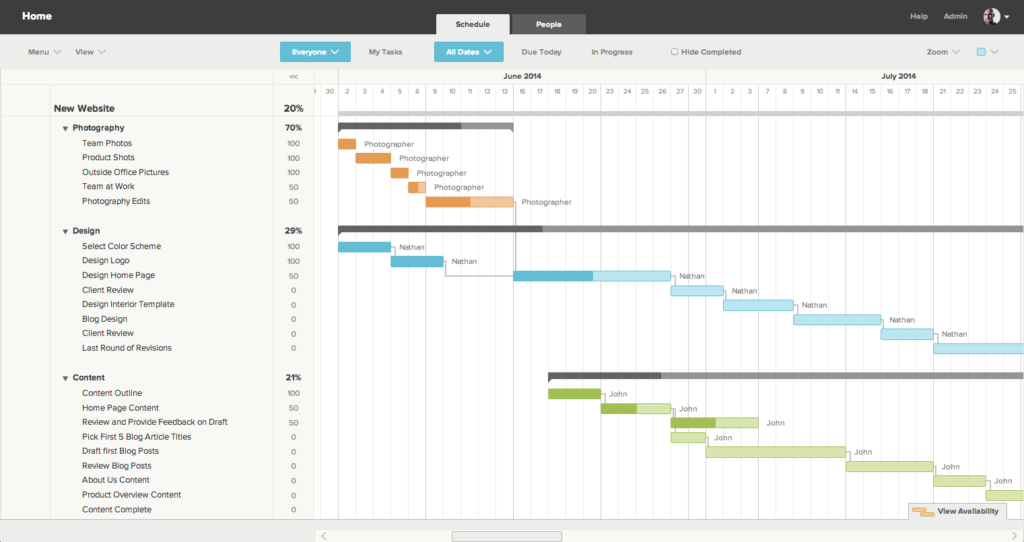
For those who are unfamiliar, a Gantt chart is a way of seeing a project’s lifespan in a single image. It shows all of the tasks in chronological order. Further details can be added, such as who is responsible for each task, and which tasks are dependent on others.
Most projects have a timescale of 3-6 weeks. EcoProMIS however, is a five year initiative, so the scale and detail required in our Gantt is significant. I have certainly enjoyed the challenge of creating it.
Open Source Trial
In order to choose the most appropriate and affordable Gantt software, I tested six different products. Most have the same features and similar pricing, so it was difficult to navigate the options.
Initially I settled on Open Project, an open-source product that can be self-hosted. Having access to our own servers and our own world-class IT team meant this seemed like an easy option, and the open-source values resonate with our vision to make positive change in the world.
Unfortunately, the maintenance for this self-hosted option was excessive and beyond the availability that our team had. I made the reluctant decision to start again and transfer to a paid system hosted in the cloud.

TeamGantt
Leaving Open Project behind, I settled on a dedicated and affordable product called TeamGantt. It is a responsive and clean-looking Gantt chart, with all the features that we required. In early June I rebuilt the entire project plan from scratch on this new system. This was frustrating but ultimately served to refine the end result, which is now working well.
The EcoProMIS Gantt structure is based on quarterly tasks and milestones. This is because each quarter we deliver tangible outputs and report on these to our funder, the UKSA.
A Dynamic Map
It is an important point to state that the Gantt chart is not a static document that once created is filed away somewhere. Part of the purpose of the chart is that it is alive, a tool or dare I say ‘friend’ of the project. It is used as a dynamic and responsive communication and management resource.
In practice, this looks like using the Gantt chart in a screen-share during our meetings, to communicate expectations around each others’ roles, and to plan timelines and scheduling.
A Gantt chart is also a reference point for everyone in the project to use. At any stage and any time zone, our team can login in to the website and see their own tasks, their colleagues’ tasks, and how the entire five year project fits together.
Likewise, it can serve new arrivals to our team. For example, recently I met with Rodrigo Gil, our new Crop Modeller, to look at the Gantt and show where the project has come from over the past three years. This forms an essential part of new colleague induction.
Effective Project Delivery and Culture Change
All of this work and technicality is ultimately to aid the smooth delivery of a complex multi-faceted project. Our new cloud-based Gantt chart is a great asset to the team, and I believe will improve our ability to reach the demanding goals and cutting-edge targets of EcoProMIS.
The colourful and clean digital interface is appealing and immediately gets attention. The details of the task interdependencies and scheduling of roles and timeframes, means that all partners are better equipped and more accountable in their work.
I also note that by introducing an effective Gantt chart, it can bring an organisational culture-change. Using an accessible Gantt chart contributes to a change in mindset from loose project delivery and inefficiency; to a much tighter project, with greater cost and time efficiencies and hopefully a happier, more connected workforce, better able to deliver our mission to support the Colombian rice and oil palm growers.